

Bond liquidity on LuxXPrime: decoding 5 months of spread data


When buying or selling a bond, the gap between the price available to buy and price available to sell – known as the bid-ask spread – represents the real cost of trading. The tighter the spread, the lower the cost of entering or exiting a position. For fixed income investors, that gap matters as much as the yield itself.
LuxXPrime is the bond trading segment of the Luxembourg Stock Exchange (LuxSE) dedicated to retail-sized tickets, and supported by Prime Liquidity Providers committed to continuous, firm, executable pricing across more than 2,500 instruments.
Using a measure called the Time-Weighted Average Spread (TWAS), LuxSE publishes spread data for its LuxXPrime segment on a monthly basis in its Trading Dashboard. TWAS averages spreads over the time they are actually tradable, rather than capturing a single point-in-time quote. It therefore better reflects the spread an investor would realistically experience when executing a trade.
Drawing on the data across January-May 2026, three key trends emerged – each illustrated in the chart below.
LuxXPrime EUR TWAS – long-dated bonds (7+ years)
January–May 2026 – basis points (USD shown for comparison)
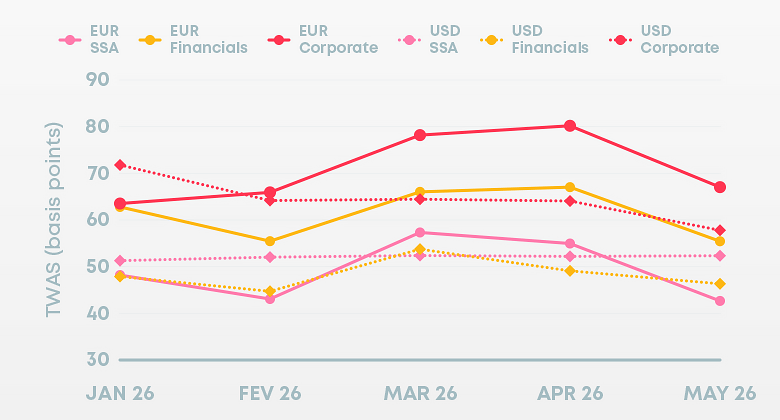
Source: LuxSE / LuxXPrime monthly Trading Dashboard. TWAS = monthly median of the Time-Weighted Average Spread on continuous firm prices.
Orderly spreads prevailed amid market uncertainty
Geopolitical tensions and macroeconomic uncertainty drove significant volatility across global bond markets, particularly in March and April. Against this backdrop, LuxXPrime spreads moved in a controlled, orderly manner. There were no market dislocations, nor any segments that became untradable, and the usual hierarchy between sectors held throughout. The data indicates that firm prices remained continuously available, both as conditions deteriorated and as they began to normalise in May.
USD spreads more stable – and tighter under stress
The chart clearly illustrates this pattern. The bold EUR lines climb and diverge, particularly EUR Corporate, which widened from 63.5 to 80.2 basis points (bps) in April, before retracing to 67.0 bps in May. By contrast, USD spreads remained broadly stable across the full five-month period. USD SSA hovered close to 52 bps throughout, while USD Corporate tightened steadily from 71.8 bps in January to 57.8 bps in May.
USD did not start the period with a consistent advantage – in January, both EUR SSA and EUR Corporate traded slightly inside their USD equivalents. As EUR spreads widened through March and April, USD remained resilient and opened a clear cost advantage at the longer end of the curve. By May, with EUR spreads retracing sharply, that gap narrowed again, with EUR SSA finishing as the tightest of all six series at 42.7 bps.
Both markets were exposed to the same global stress, but the deeper liquidity of USD-denominated paper appears to have absorbed the shock more smoothly – a pattern visible in the data and not specific to LuxXPrime.
Maturity and credit risk were the primary drivers of EUR spread widening
Spreads scaled predictably with both maturity and credit risk. While the chart focuses on the long end (7+ years), the same hierarchy is consistent across all maturities: short-dated SSA bonds (sovereign, sub-sovereign and agency issuers) consistently exhibited the tightest spreads throughout the period, typically around 25–30 basis points.
At the other end of the spectrum, long-dated EUR Corporate bonds – shown by the red line – recorded the widest spreads, peaking at approximately 80 basis points in April before retracing to 67 bps in May. Each step up the maturity ladder, and each step down the credit ladder, incrementally increased spread levels by a few basis points.
Across the five-month period, short-dated SSA and financial paper consistently remained the tightest segments in the dataset.
How do these spreads compare?
A natural follow-up question is how LuxXPrime TWAS levels compare with spreads observed on comparable instruments traded in retail size across other European venues. Over the five-month period, spreads were broadly in line with peer markets and tighter in several segments – particularly in short-dated SSA and short-dated Financials.
This outcome reflects the structural mechanics of the venue rather than any single period of market conditions. Continuous firm pricing from Prime Liquidity Providers, a minimum 80% order-book presence requirement, and a curated set of liquid instruments together establish a natural floor for quoted-price quality. When broader market volatility widened spreads in March and April, the same repricing appeared in the LuxXPrime data – but from a tighter starting point and within a more constrained range. The May normalisation followed the same pattern in reverse.
About the data
All figures referenced here are drawn from the monthly LuxSE Trading Dashboard, which publishes TWAS data by sector and maturity bucket. Background on the LuxXPrime segment, including its Prime Liquidity Provider model and the universe of instruments quoted, is available at luxse.com/trading/luxxprime.
LuxXPrime by Luxembourg Stock Exchange.
This document is provided for information purposes only and does not constitute investment advice or a recommendation.